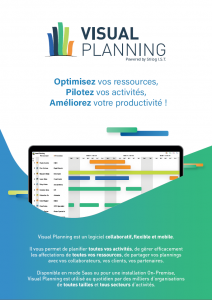
Stilog is very happy to announce the release of the latest version of Visual Planning, Visual Planning 5.3.
On November 24, Stilog gathered Visual Planning clients and partners at the Institut du Monde Arabe, a prestigious Parisian venue dedicated to arts in the Arab world, to present them its newest version of the scheduling software.
More than 200 people attended the busy event, which included opening words by Christophe Poirmeur, the company’s founder and CEO, a tour of Stilog’s services, an hour-long keynote with product developers, and of course: live demos and business use cases. Users, consultants, sales teams and developers, all participated to the event’s success.
The new features included in this latest version were obviously at the center of the attention. A large portion of them were demonstrated live during the afternoon, using real examples of planners and scenarios used by business customers around the world. The following were among the audience’s favorites:
- New Kanban mode – inspired by the Kanban representation, this new display mode for events view allows users to order events based on the resources of a dimension. It’s a great way to review project statuses, on-going tasks and to-do lists. If the view is displayed in detail mode, a new option allows users to entirely customize the design of the cards using HTML and event data.
- This was paired up with a brand new workflow management feature, that operation managers can quickly set up to enforce a validation process flow among all users, and make sure projects, jobs or tasks move along the flow efficiently based on company-wide rules
- A new design and increased possibilities for the VP Portal interface- the interface has been completely renewed with a new and modern design, allowing users to review and edit schedules and projects directly on a tablet or a smartphone.
- Better event reports – event reports have been enhanced to provide better data visualization. Users will now be able to create line graphs in addition to the already existing bar charts and pie charts, and can now customize the reports with custom titles, fonts and colors. New calculation options have also been added to table reports, as well as color thresholds and a long-awaited drill down functionality.
Want to read more on those new features? Get details and examples in this PDF.
And don’t forget – if you are already a customer, you can get a free upgrade to Visual Planning 5.3 as part of your maintenance contract or cloud subscription. Contact your sales representative or get in touch with us at sales@stilog.com.


